
Fig. 1.
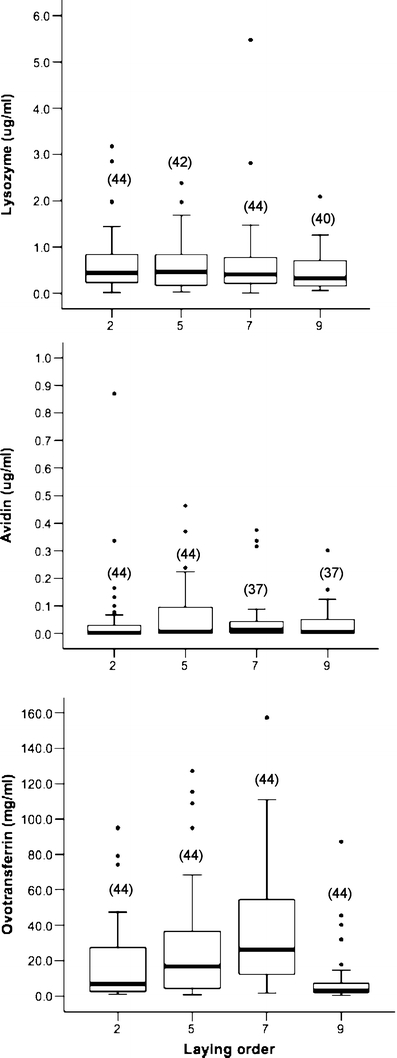
Concentration of antimicrobial proteins by laying order in blue tit eggs. The line within each box represents the median concentration, the lower and upper borders are the 25th and 75th percentiles, and the lower and upper bars are the tenth and 90th percentiles. Sample sizes are in parenthesis at the top of each box. Outliers (values between 1.5 and 3 from the interquartile range) are represented with circles