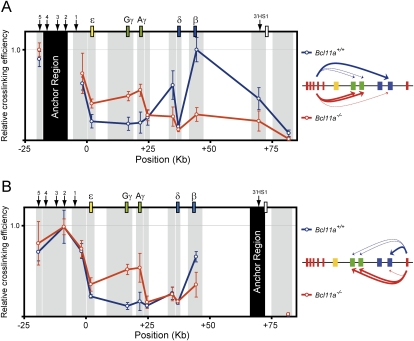
Figure 2.
BCL11A reconfigures the human β-globin cluster. Locus-wide cross-linking frequencies show reconfiguration of the human β-globin cluster in the absence of Bcl11a. Relative cross-linking frequencies observed in wild-type (Bcl11a+/+) E14.5 fetal liver erythroid cells are shown in blue, and Bcl11a−/− cells are shown in red. Gray shading indicates position and size of the analyzed fragments, and black shading represents the “anchor region” HS2–HS4 (A) and 3′HS1 (B). Spatial organization of the human β-globin locus is indicated at the top. Schematic diagrams representing the three-dimensional interactions that occur within the human β-globin cluster are shown at the side. In each graph, the highest cross-linking frequency value was set to 1. The X-axis shows position (in kilobases) in the locus. All data are plotted as the mean ± SD of the measurement.

