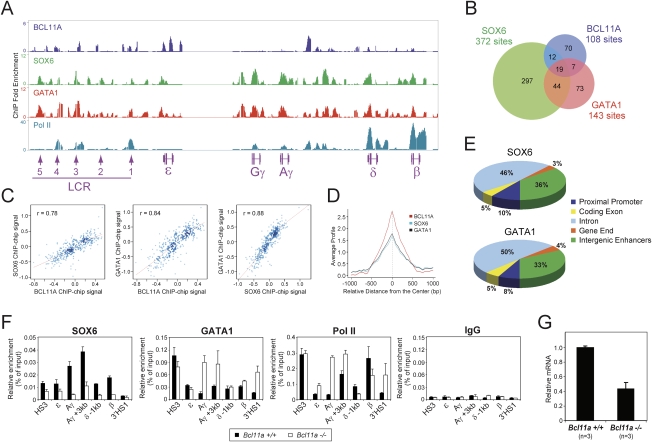
Figure 5.
Chromatin occupancy of BCL11A, SOX6, and GATA1 within the human β-globin locus in adult human erythroid progenitors. (A) In vivo chromatin occupancy of BCL11A, SOX6, GATA1, and RNA Pol II was examined by ChIP–chip in human erythroid progenitors. Precipitated DNA samples were amplified and hybridized to human ENCODE 2.0R array. A genome browser representation of binding patterns at the human β-globin cluster is shown. Relative positions of the human β-like globin genes and the upstream LCR consisting of five DNase I HSs (1–5) are shown at the bottom. (B) A Venn diagram of genome-wide colocalization of BCL11A, SOX6, and GATA1 ChIP–chip sites is shown. (C) Genome-wide analysis of BCL11A, SOX6, and GATA1 cooccupancy is shown. Scatter plots display mutual enrichment between indicated ChIP–chip data sets relative to the input. Correlation values are shown. (D) Sitepro (Shin et al. 2009) analysis of genome-wide correlation between the indicated ChIP–chip data sets. The average signal (from a WIG) is shown for a 2-kb region surrounding the center of ChIP–chip sites from the BCL11A.ab1 data set. (E) Distribution of SOX6 and GATA1 enrichment peaks located in the promoter (−3 kb to +1 kb), coding exon, intron, gene end (5′UTR and 3′UTR), or intergenic enhancers (outside of these defined regions) is shown. (F) In vivo chromatin occupancy of SOX6, GATA1, and RNA Pol II was examined by ChIP in E14.5 fetal liver cells from β-YAC control mice (Bcl11a+/+) and Bcl11a-null mice (Bcl11a−/−). Precipitated DNA samples were quantified using primers designed to amplify several control regions within the human β-globin locus as indicated below each graph. The ChIP signals are shown as a percentage of the input DNA signal. Results are mean ± SD of three independent experiments. (G) Relative mRNA expression of SOX6 was examined by real-time RT–PCR in FACS-sorted Ter119+CD71+ E14.5 fetal liver erythroid cells from Bcl11a+/+ (wild-type, n = 3) and Bcl11a−/− (n = 3) embryos. Transcript levels were normalized against mouse Gapd transcript levels. Results are means ± SD.

