Figure 3.
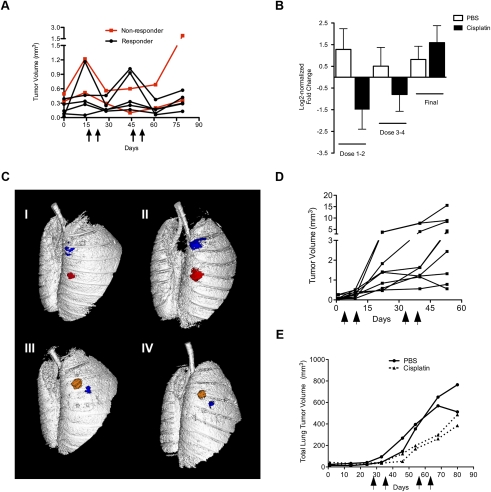
In vivo microCT imaging reveals lung tumor regression and stasis in response to cisplatin in LSL-KrasG12D/+ mice, and decelerated growth in LSL-KrasG12D/+;p53fl/fl mice. (A) Tumor volume dynamics of individual cisplatin-treated tumors in LSL-KrasG12D/+ mice. Black arrows on the X-axis indicate cisplatin treatments. Red lines indicate tumors that stopped responding to treatment after three to four doses. The X-axis indicates days following the first pretreatment microCT scan, which occurred 14 wk post-AdCre infection. (B) Log2-normalized fold change in tumor volume of individual tumors in PBS-treated (white bars) and cisplatin-treated (black bars) mice. Tumor volumes were quantified before and after doses 1 and 2 (Dose 1–2), before and after doses 3 and 4 (Dose 3–4), and before and after one final dose (Final). (C) Representative microCT lung reconstructions before and after two doses of PBS (panels I,II) or cisplatin (panels III,IV) with individual lung tumors pseudocolored. (D) Tumor volume dynamics of individual cisplatin-treated tumors in response to cisplatin in LSL-KrasG12D/+;p53fl/fl mice. Black arrows on the X-axis indicate cisplatin treatments. (E) Total lung tumor volume in LSL-KrasG12D/+;p53fl/fl mice (n = 2 mice per group) treated with four doses of PBS (solid lines with circles) or cisplatin (dashed lines). Arrows on the X-axis (days following AdCre infection) indicate one dose of PBS or cisplatin.

