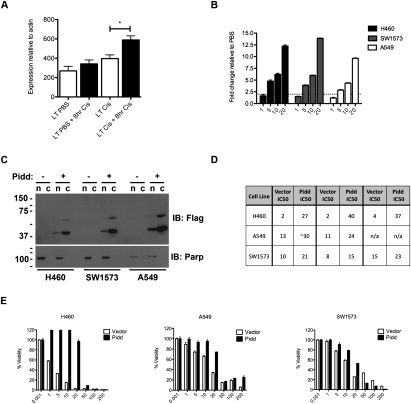
Figure 7.
Overexpression of PIDD confers resistance to cisplatin in human NSCLC cell lines. (A) Expression levels of Pidd mRNA in LSL-KrasG12D/+ lung tumors treated with PBS or four total doses of cisplatin, with or without a final 8-h dose of cisplatin (n = 6 tumors per group). P < 0.01. Error bars represent SEM. (B) Expression levels of PIDD mRNA in human NSCLC lines treated with increasing doses of cisplatin (micromolar) and harvested 24 h following treatment. The Y-axis is fold change relative to PBS-treated cells. Expression levels are normalized to ACTIN. (C) PIDD overexpression in human NSCLC lines by Western blot (IB) for Flag, and for Parp to confirm purity of nuclear/cytoplasmic fractions. Upon longer exposure, full-length PIDD is apparent in the cytoplasm, and both PIDD cleavage products are also present in the nucleus (data not shown). (D) IC50 values for cisplatin treatment in each cell line with MSCV Vector or MSCV-PIDD expression from three independent experiments performed in triplicate. (E) Representative survival plots for indicated cell lines expressing MSCV Vector or MSCV-Pidd treated with 0–200 μM cisplatin (X-axis) and analyzed 48 h later using CellTiter-Glo cell viability assay. The Y-axis represents percent of viable cells normalized to PBS-treated control. Error bars represent standard deviation.

