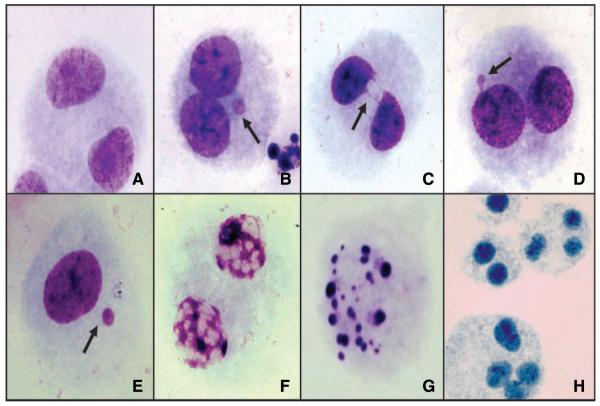
Figure 1.
Representative images of cells scored using the CBMN Cyt assay: (A) normal binucleated cell, (B) binucleated cell with micronuclei, (C) binucleated cell with nucleoplasmic bridge, (D) binucleated cell with bud, (E) mononucleated cell with micronucleus, (F) cell in necrosis, (G) cell in apoptosis, and (H) polynucleated cells.

