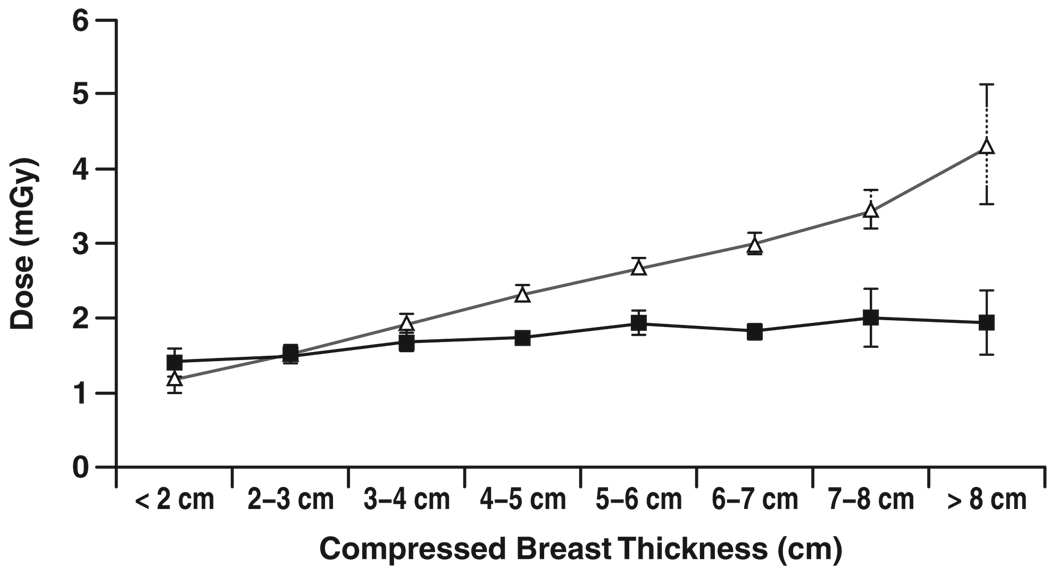
Fig. 4.
Chart shows comparison of mean glandular dose from single view for screen-film (Δ) and digital (■) mammography versus compressed breast thickness for examinations conducted at Fischer SenoScan digital sites. Error bars represent 95% CIs. Where 95% CIs do not overlap, differences are statistically significant.

