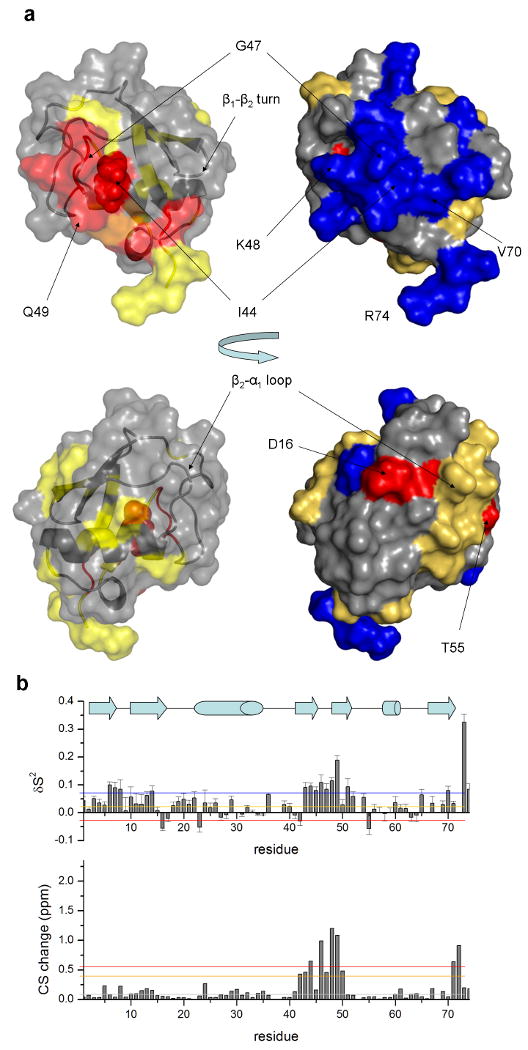
Figure 3. Backbone dynamics of ubiquitin decrease within the UIM interaction surface upon binding.

Changes in backbone chemical shifts and fast timescale motions are shown. (a) sites that undergo chemical shift perturbations closely correlate with those that show a decrease in the generalized order parameter. Two opposite views of the molecule are shown, the top containing the UIM-binding interface. Colors are based on grouping according to upper and lower bounds of ppm distances and order parameter changes respectively, as indicated by the color bars in the corresponding graphs (b).
