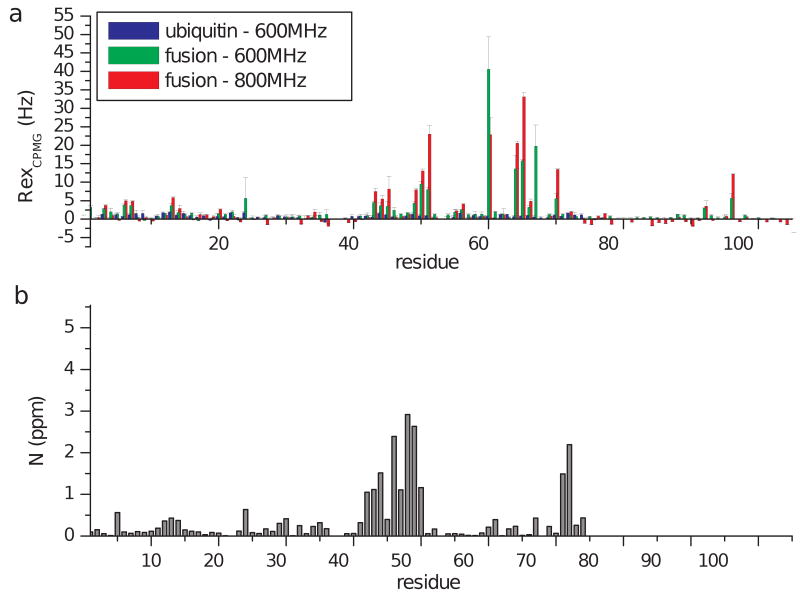
Figure 4. Summary of CPMG-derived exchange rates.
As an indication of conformational exchange, the exchange contribution to the transverse relaxation rate, Rex, is shown for amide nitrogen atoms along the sequence of ubiquitin and fusion proteins (a). These values are derived as the difference between peak intensities obtained at zero and high (938Hz) CPMG frequencies. For comparison with the location the UIM binding interface, 15N chemical shift changes in the presence of the UIM are shown (b). No significant exchange contribution to R2 was observed for most sites in ubiquitin (blue), while for the fusion protein the presence of conformational dynamics is manifested as high Rex values at several sites, for both the 600 and 800MHz data (green and red respectively). For Asp24, Rex values could not be accurately measured due to extended line broadening in both proteins, which indicates the presence of conformational exchange at the μsec-msec timescale.

