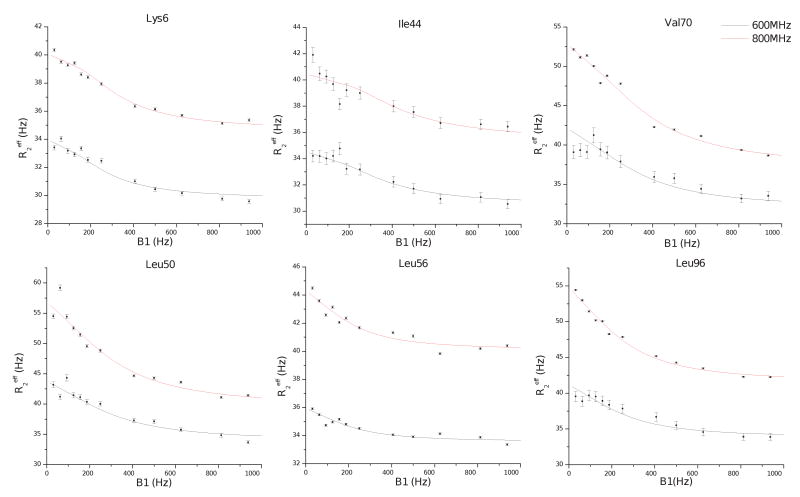
Figure 5. Representative CPMG relaxation dispersion data.
Effective transverse relaxation rates are shown as a function of the CPMG power, in units of Hz. For each site, independent fits of the modified form of the Carver-Richards equation (equation 1 in materials and methods) are also plotted. The fitted parameters for these sites can be found at table 2. Residues participating in similar conformational motions, in terms of the global parameters (kex and pA,B) are presented in the same row. From these sites, Lys6, Ile44, Val70 and Leu96 are located on the interaction interface while Leu50 and Leu56 on the extended loop. For the ubiquitin without the UIM the corresponding curves are flat, indicating induced dynamics at the μsec to msec timescale upon UIM docking.

