Figure 1.
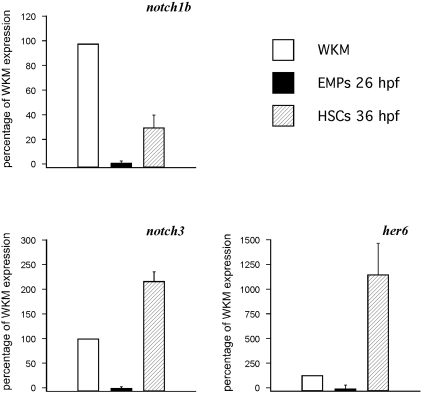
HSCs, but not EMPs, express Notch pathway genes. qPCR analysis of notch1b (top left), notch3 (bottom left), and the Notch target her6 (bottom right) on 26-hpf EMPs and 36-hpf HSCs, with whole kidney marrow (WKM) as reference standard. The y-axis indicates percentage relative to WKM, defined as 100% in all examples. Results are the average of 3 experiments; error bars represent standard deviation.

