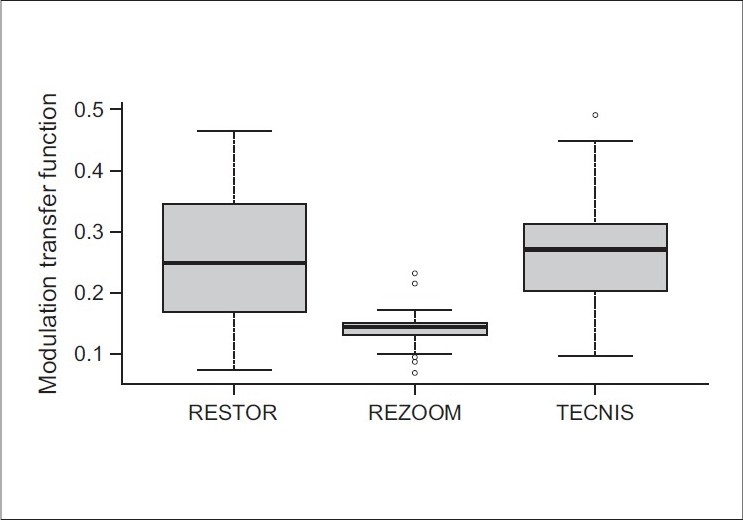
Figure 2.

Box plot showing the average height from the modulation transfer function curve according to IOL groups. The aberrometer device used in this study gives an average height for each MTF curve. This box plot shows the average height and the difference among three multifocal IOLs, considering the mean modulation transfer ratio at the spatial frequencies evaluated in the study. The contrast transferred was statistically similar in the Tecnis and ReSTOR group. For a 5 mm pupil diameter, the ReZoom group transferred less contrast (P < 0.05)
