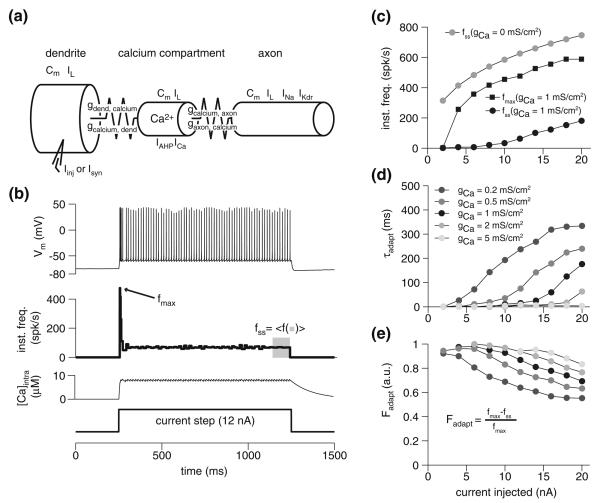
Fig. 1.
The spike-frequency adaptation model and its basic properties. a Schematic of the three-compartment model employed for simulations. Cm denotes membrane capacitance, Ix (x = L, stim, Ca, Na and Kdr) denotes the presence of a particular current (Sect. 3). The coupling conductance from compartment a to b, is denoted by ga,b and is asymmetric (i.e., ga,b ≠ gb,a; see Sect. 3). b Response of the model to a 12 nA depolarizing current injection, with gCa = 1 mS/cm2. From top to bottom, panels show the membrane potential response, instantaneous frequency, intracellular calcium concentration, and current step, respectively. c Peak (fmax) and steady-state (fss) response frequency during current injection. Black circles and squares show response in model with adaptation (gCa = 1 mS/cm2); grey circles show the steady-state for the model without adaptation (gCa = 0mS/cm2). Size of current step indicated on abscissa. d Adaptation time constant for various injection currents and levels of calcium conductance. e Adaptation ratios for the same current injection levels as in d

