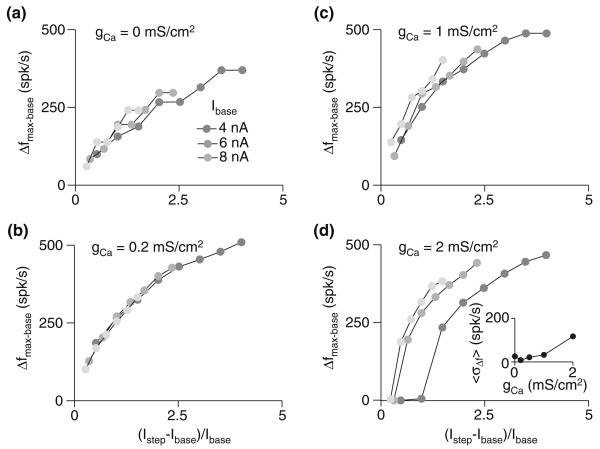
Fig. 3.
Spike-frequency adaptation renders a cell's response to relative input intensity changes largely invariant to baseline input. a–d Maximal change in firing frequency (Δfmax−base) for various baseline currents (Ibase; gray scale, as indicated in panel a) and relative current step sizes ((Istep − Ibase)/Ibase). The four panels show the response of the model with varying degrees of spike-frequency adaptation: none (gCa = 0 mS/cm2; a), below the physiological-fit value (gCa = 0.2 mS/cm2; b), fit to the underlying physiology (gCa = 1 mS/cm2; c), and above the physiological-fit value (gCa = 2 mS/cm2; d). The inset in panel d shows response variability (〈σΔf〉; see Fig. 2) as a function of gCa; in this case, the mean was computed across (Istep − Ibase)/Ibase

