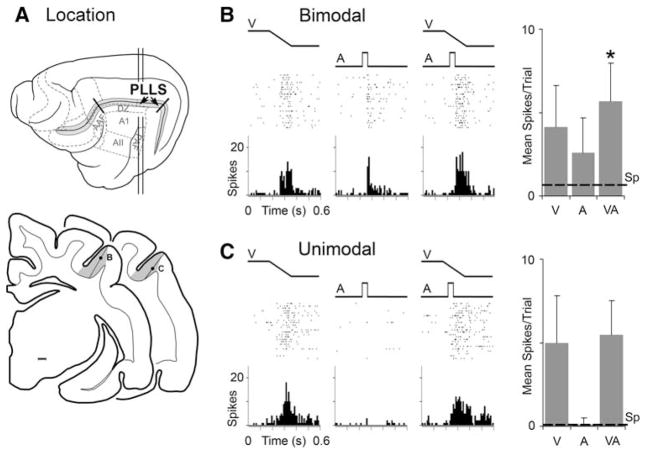
Fig. 2.
Location of the PLLS and representative sensory/multisensory responses. In (a), the lateral view of the cat cerebral cortex shows the suprasylvian sulcus opened (grey) and the location of the PLLS (arrows). Some auditory cortical fields are also depicted. The vertical lines indicate the levels from which the lower, coronal sections are derived. On the coronal sections, the grey shaded area indicates the location of the PLLS; each dot represents the location of the neurons whose responses are depicted in parts (b) and (c). In (b), this bimodal PLLS neuron responded (raster = 25 trials; histogram = 10 ms time bins) to the presentation of a visual stimulus (ramp labeled ‘V’) as well as to an auditory stimulus (square wave labeled ‘A’). In the third panel, both visual and auditory stimuli are presented together (VA) and an even more vigorous response was recorded. The responses to the different stimulus conditions are summarized in the bar graph (far right; mean spikes/trial and standard deviation); dashed line = spontaneous activity level; ‘*’ statistical significant (P < 0.05, paired ‘t’-test. Part (c) illustrates the responses of a unimodal PLLS neuron. It was strongly activated by a visual stimulus, but an auditory stimulus had no effect either alone or in combination with the visual cue

