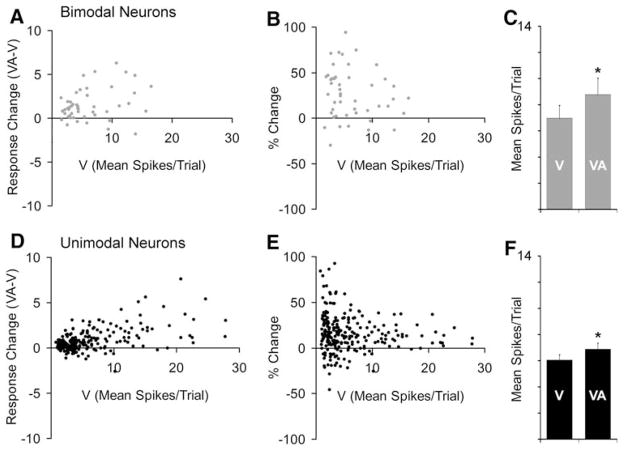
Fig. 3.
Bimodal as well as unimodal PLLS neurons show multisensory effects. In (a) and (d), the graphs plot the visual response (V) versus the multisensory response change (visual response subtracted from combined visual-auditory response) for bimodal and unimodal PLLS neurons. For bimodal neurons (n = 49), combined (VA) responses were greater than the visual (V) responses in a large proportion of neurons, and multisensory responses tended to increase with increases in visual responsiveness, as shown in (a). These data are re-plotted in (b) to show that the proportion of response change (%) was overwhelmingly in the positive direction. The bar graph (c) shows that the average response of bimodal neurons was significantly (P < 0.05, paired ‘t’-test) increased from 7.0 ± 1.0 mean spikes/trial to 8.8 ± 1.3 mean spikes/trial when an auditory stimulus was also present. Surprisingly, these same trends were observed for the larger population of unimodal PLLS neurons (n = 233), which were activated robustly by visual stimulation but could not be activated by an auditory stimulus presented alone. In fact, the bar graph (f) indicates that the average response of unimodal neurons was significantly (P < 0.05, paired ‘t’-test) increased from 6.0 ± 0.4 mean spikes/trial to 6.9 ± 0.7 mean spikes/trial when visual was combined with auditory stimulation

