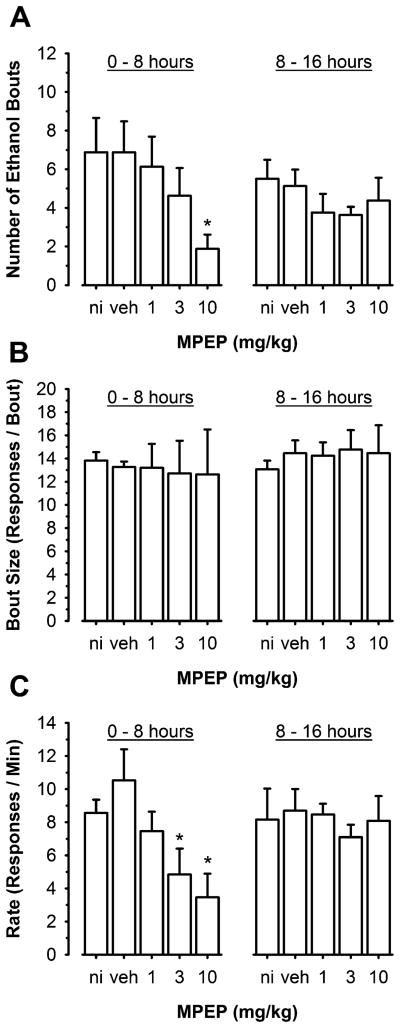
Fig. 2.
The mGluR5 antagonist MPEP significantly altered parameters of ethanol-reinforced response bouts. a Total number of ethanol response bouts plotted as a function of MPEP dosage. b Total number of responses per bout plotted as a function of MPEP dosage. c Response rate (responses/minute) per bout plotted as a function of MPEP dosage. All data are plotted as mean±SEM during the first and second 8-h periods of the sessions. Asterisk significantly different from no-injection (ni) and vehicle (veh) control (Tukey test, p<0.05)

