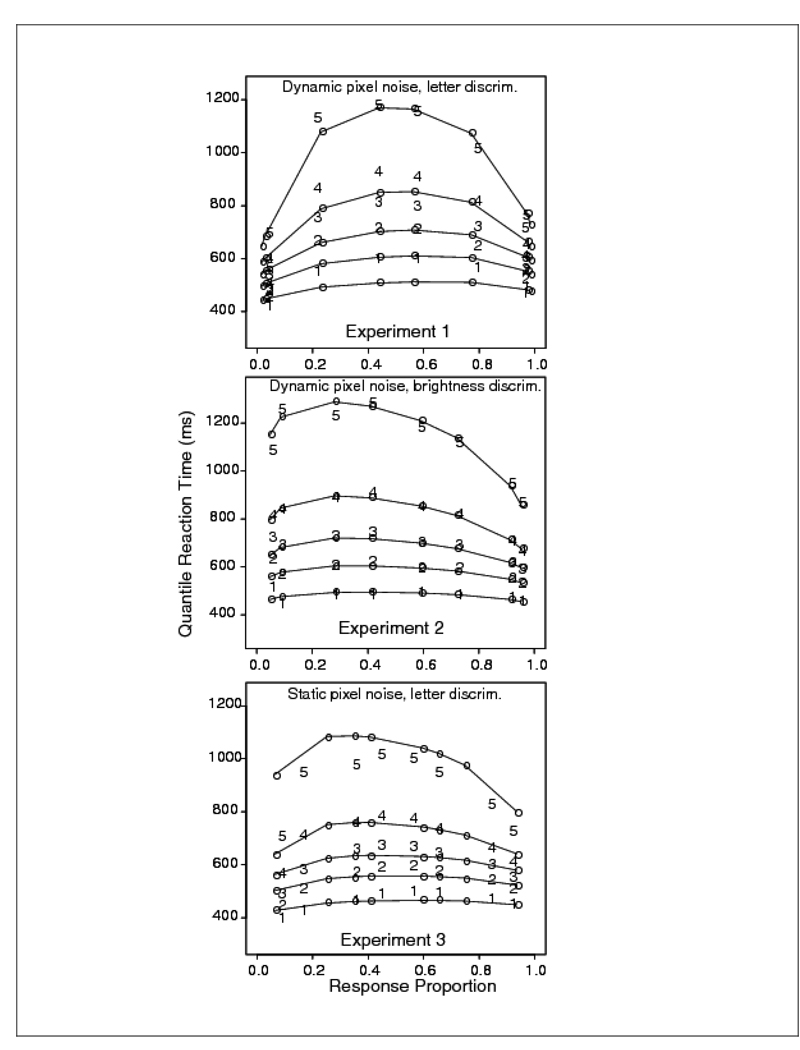
Figure 4.
Quantile probability plots for Experiment 1 (letter discrimination with dynamic random pixel noise), Experiment 2 (brightness discrimination with dynamic random pixel noise), and Experiment 3 (letter discrimination with static random pixel noise). The digits 1–5 represent the quantile RTs (as in Figure 2) from the data, and the circles are the predicted values of the quantile RTs from fits of the diffusion model.

