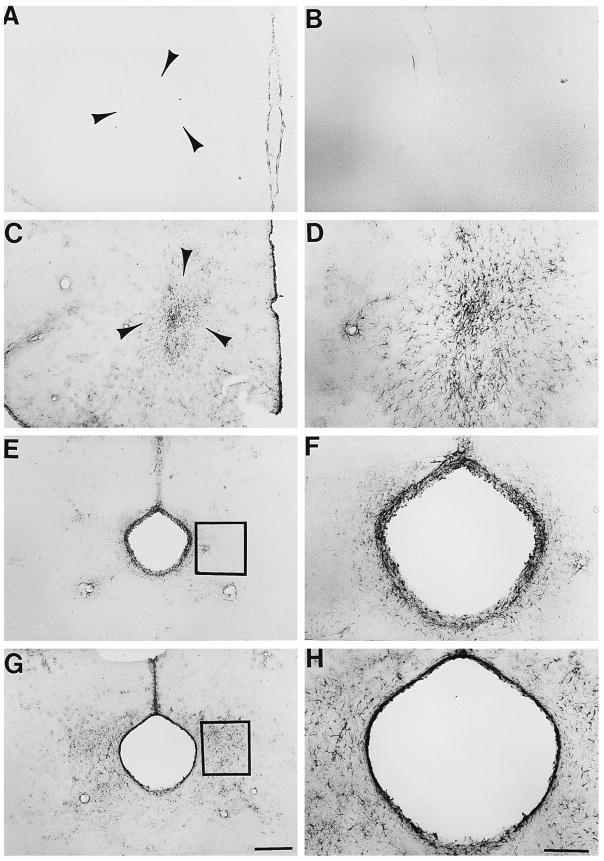
Fig. 1.
Nf1/nf1 mouse brain astrocytes show increased GFAP expression in nucleus accumbens and periaquductal grey. Sections through nucleus accumbens (A–D) or periaqueductal grey (E–H) were stained with anti-GFAP antibody, and labeling visualized as described in Section 2. Sections from wild type mice are shown in A, B, E, and F. Sections from Nf1/nf1 mice are shown in C, D, G, and H. Low magnification photographs are shown in the left panel (Bar = 100 μM); higher magnification views are on the right (Bar = 50 μm). Arrowheads in A and C circumscribe the area of the nucleus accumbens. Boxes in E and G designate areas analyzed for cell number and cell size.

