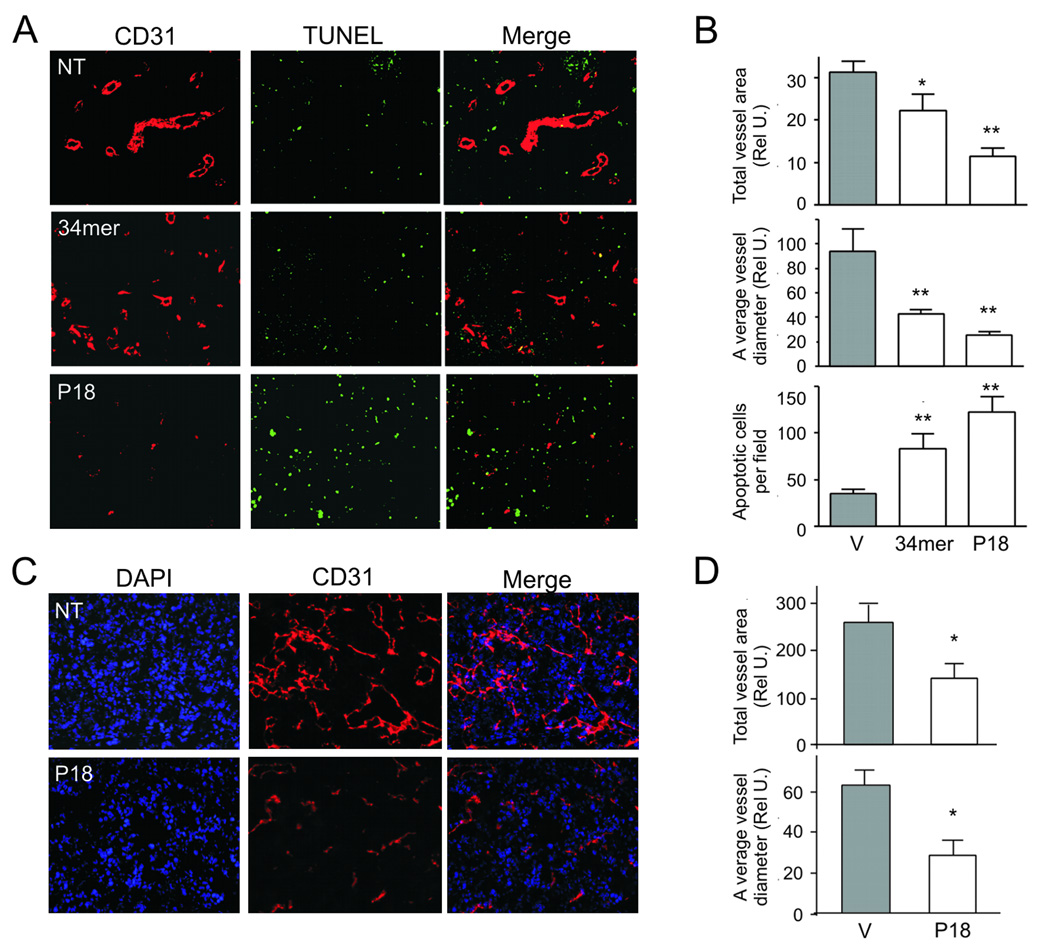
Figure 5. Inhibition of tumor angiogenesis by P18.
(A, B) Prostate tumor xenografts from the mice treated with 34-mer, P18 or vehicle control (V) were sectioned and stained for CD31 endothelial marker (red). Apoptosis was visualized by in situ TUNEL (green). Representative sections are shown (A); (B) total vascular area (top), average vessel diameter (middle) and the number of apoptotic cells per 10X (bottom) field were determined using MetaMorph software. Asterisks indicate statistically significant differences compared to bFGF as was measured by One Way ANOVA followed by Dunnett's Multiple Comparison Test (*, P<0.01, **, P<0.001). (C, D). Renca tumors treated with P18 or vehicle (V) were sectioned and stained for CD31, to visualize microvasculature (red). The sections were counterstained with DAPI (blue) to visualize nuclei. Represenative sections are shown (C). (D) Vascular area (top) and average vessel diameter (bottom) were determined as above. Note dramatic decrease in the vascularization and decreased cellularity of the P18 treated tumors.

