
Figure 2. Categorical Change in Carotid Intimal Medial Thickness in SANDS Subgroups.
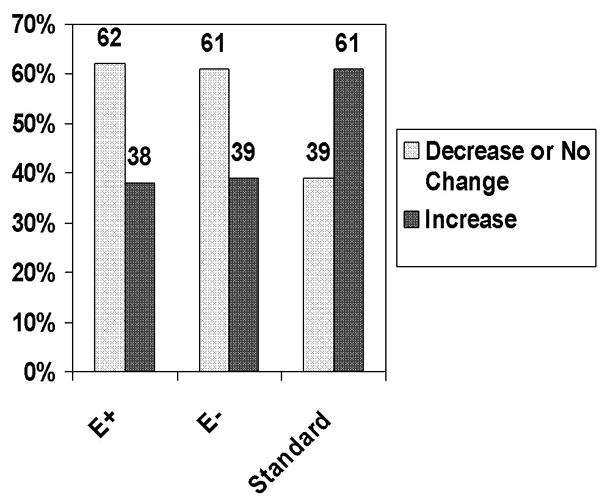
Numbers represent percentages of participants who experienced a decrease or no change in CIMT greater than 0.01mm versus an increase. The majority of both aggressive subgroups experienced a decline or no change in IMT, whereas the majority of the standard group showed an increase, p<0.0001.
E+ = statin plus ezetimibe; E− = statin alone