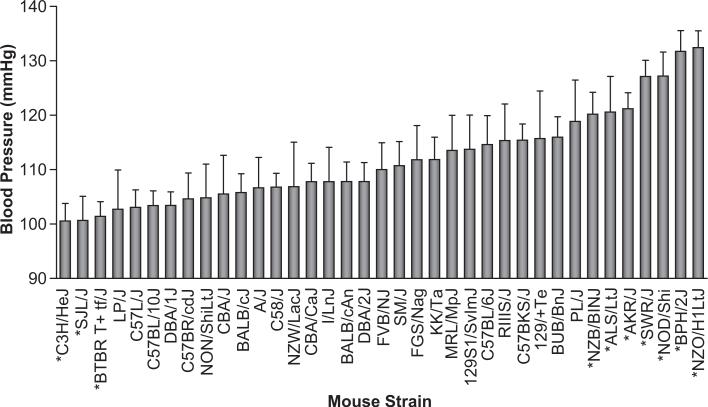
Figure 1. Systolic blood pressures in mice from 37 inbred strains.
Strains marked with the same letter were intercrossed to produce F2 populations for linkage analysis. Bars represent tail-cuff blood pressures for mice from each strain given as mean ± SD. Strains marked with an asterisk are significantly different (P < 0.05 by Tukey's Honestly Significantly Differences test) from the median strain (i.e., FVB). Please see Table S1 (http://hyper.ahajournals.org) for a summary of all significant differences between the strains.

