
Figure 2.
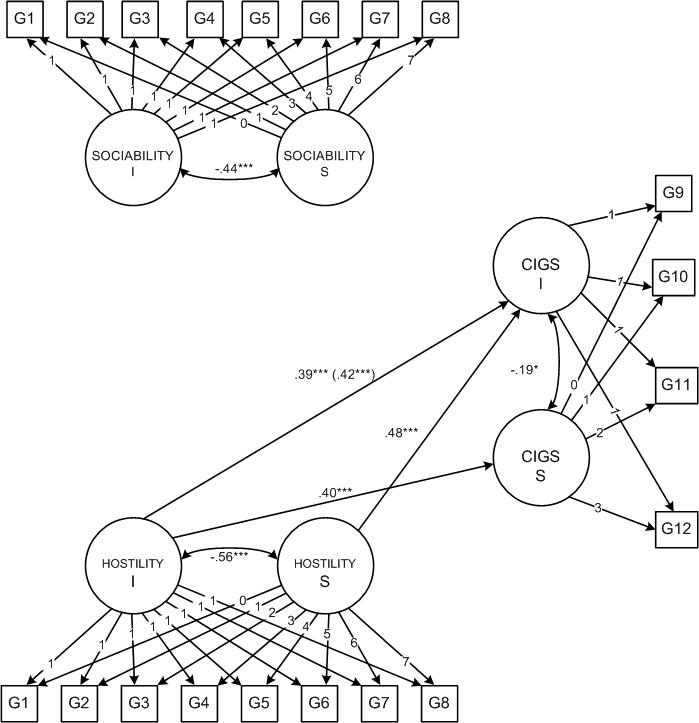
Hostility and sociability in elementary and middle school predicting cigarette use in high school.
NOTE: Hostility and sociability were measured at seven assessments (T1 – T7) and cigarette use was measured at four assessments (T5-T8). Therefore, using cohort-sequential analyses, sociability and hostility factors are represented by 8 grades in elementary and middle school (1st-8th) and cigarette use is represented by 4 grades in high school (9th-12th). Only significant standardized structural paths are shown. Where there were significant gender differences, estimates are shown separately for boys and girls (girls are in parentheses). Several residual correlations and correlations among the intercepts and slopes of hostility and sociability were estimated, but are not shown. I = intercept, S = slope.
* p = <. 05. ** p = < .01. *** p = < .001.