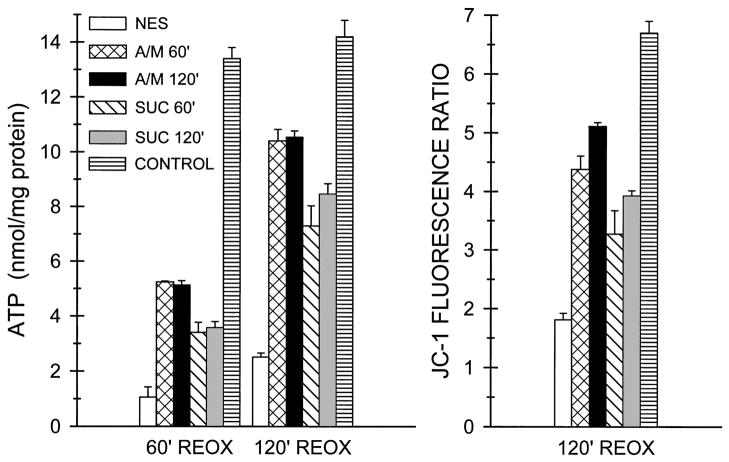
Fig. 10.
Maintenance of improved mitochondrial function after withdrawal of protective substrates. Tubules were subjected to hypoxia ± reoxygenation as for the Fig. 7 studies with either no extra substrate (NES) during reoxygenation or substrate supplementation during reoxygenation as follows: 4 mM α-KG/MAL for 60 min of reoxygenation (A/M 60′), 4 mM α-KG/MAL for 120 min of reoxygenation (A/M 120′), 4 mM succinate for 60 min of reoxygenation (SUC 60′), 4 mM succinate for 120 min of reoxygenation (SUC 120′). Tubules were sampled for ATP levels at 60 min reoxygenation (60′ REOX) and for ATP levels and JC-1 fluorescence at 120 min reoxygenation (120′ REOX). Values are means ± SE from three experiments, each with duplicate samples for every condition. All 120′ REOX values are significantly greater than the corresponding 60′ REOX values. All substrate-supplemented values are significantly greater than the corresponding NES group values. All α-KG/MAL values are significantly greater than the corresponding succinate values. Control values are for preparations incubated under oxygenated conditions for the same total durations as the experimental groups and are significantly greater than the corresponding values for the experimental groups.

