Fig. 5.
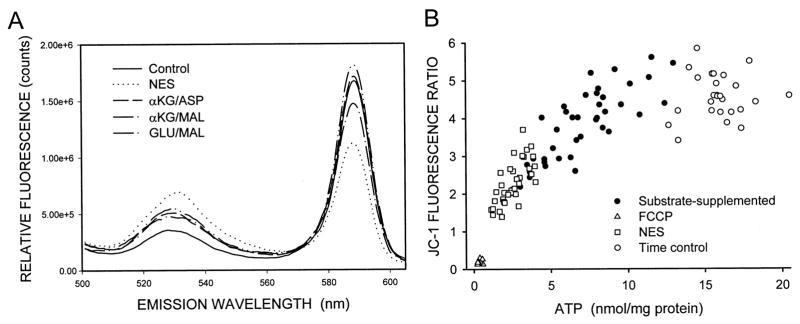
JC-1 fluorescence in solution. A: tubules were incubated under oxygenated control conditions, or for 60 min hypoxia plus 60 min reoxygenation as in Fig. 3A with either no extra substrate (NES) or 4 mM of either α-KG/ASP, α-KG/MAL, or GLU/MAL during reoxygenation. These incubations were followed by staining with JC-1, washing, and scanning of suspensions of the intact tubules at 488 nm excitation and 500–625 nm emission. The tracings shown are representative of those obtained from 10–20 experiments under each of the conditions. B: JC-1 ratios (590/530 nm) for multiple individual experiments done under the same conditions as shown for Fig. 5A plotted against the ATP levels of the same samples. Each point is the result of a single experiment. Also shown are JC-1 ratios for tubules incubated with 5 μM FCCP in the presence of 5 mm glycine for 15 min.

