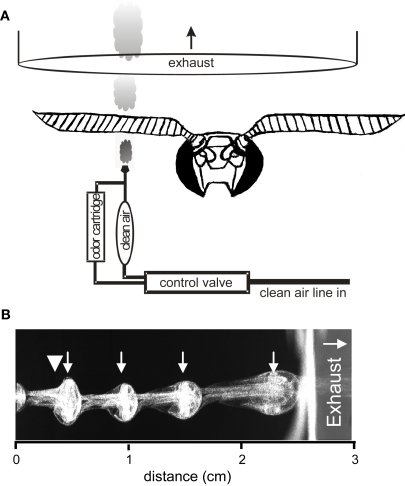
Figure 1.
Schematic of the general experimental setup in Experiments 1–3. (A) A single line feeds air into the valve and can be switched between the blank and the odor cartridges, which merge about 2 mm before the output nozzle. (B) High speed imaging of olfactometer output at 50 Hz with a velocity of 0.3 m/s and a 10:40-ms duty cycle. Titanium tetrachloride, which produces a neutrally buoyant condensate, was used to visualize this 50-Hz pulse train. The odor nozzle is just out of view to the left. The large arrowhead indicates where the antenna was placed during physiological experiments. Small inset arrows identify individual pulses. Because some titanium tetrachloride condenses at the tip of the nozzle, there is a constant stream even when the valve is not open. Note also that as individual pulses approach and pass through the opening of the exhaust (vertical white line) they are stretched indicating that the draw is faster than the puffing velocity.

