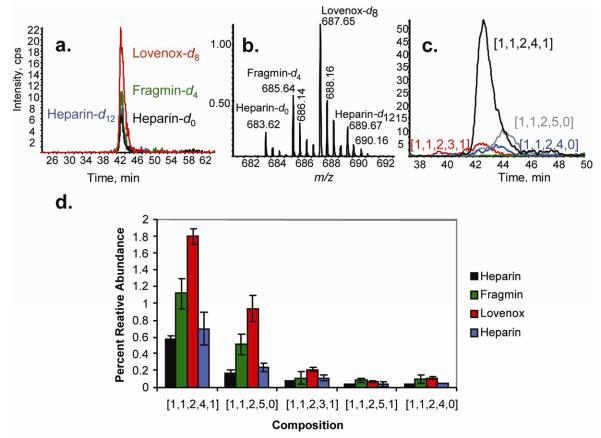
Figure 2.
a. Normal phase LC/MS extracted ion chromatograms from heparin dp4 corresponding to [1,1,2,4,1] (m/z 683-6912-) tagged with d0-heparin (black), d4 (fragmin (green), d8 (Lovenox (red), d12 (Heparin (blue)). See the Experimental Section for chromatographic conditions. b. Summed mass spectrum for the 40-44 min range in (a), showing the m/z range of 683-691 (2- charge state of [1,1,2,4,1] (heparin, fragmin, lovenox, heparin, d0:d4:d8;d12). c. Extracted ion chromatograms of : black [1,1,2,4,1], red [1,1,2,3,1], grey [1,1,2,5,0], blue [1,1,2,4,0], green [1,1,2,5,1]. d. Percentage relative abundances of isotope-coded labeled lyase-resistant dp4 fractions derived from LC-MS. Relative abundance of compositions observed containing reducing end modified structures due to the depolymerization process of pharmaceutical preparation

