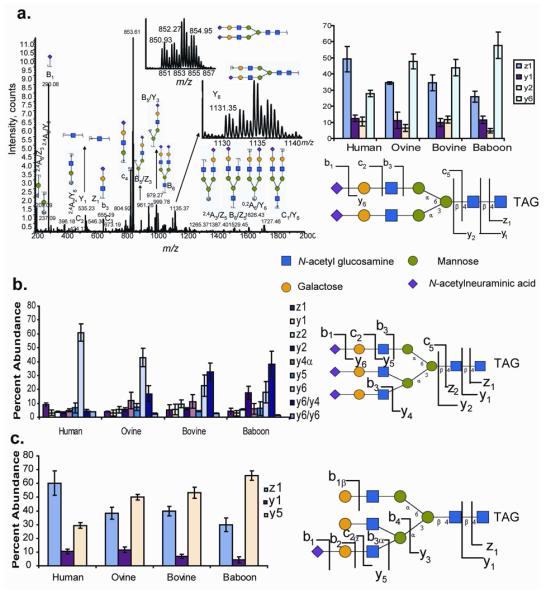
Figure 6.

a.) Tandem mass spectrum of α-1-acid glycans corresponding to compositions: a.) BiAn(NeuAc2) 3- and the relative quantification of product ions. b.) relative quantification of product ions from TriAn(NeuAc3)4- c.) relative quantification of product ions from TriAn(NeuAc1) 2 The location of the sialic acid in the representative structure is for illustrative purposes, as the sialic acid position was not determined. N-Glycan abbreviations are given in the Figure 4 legend.
