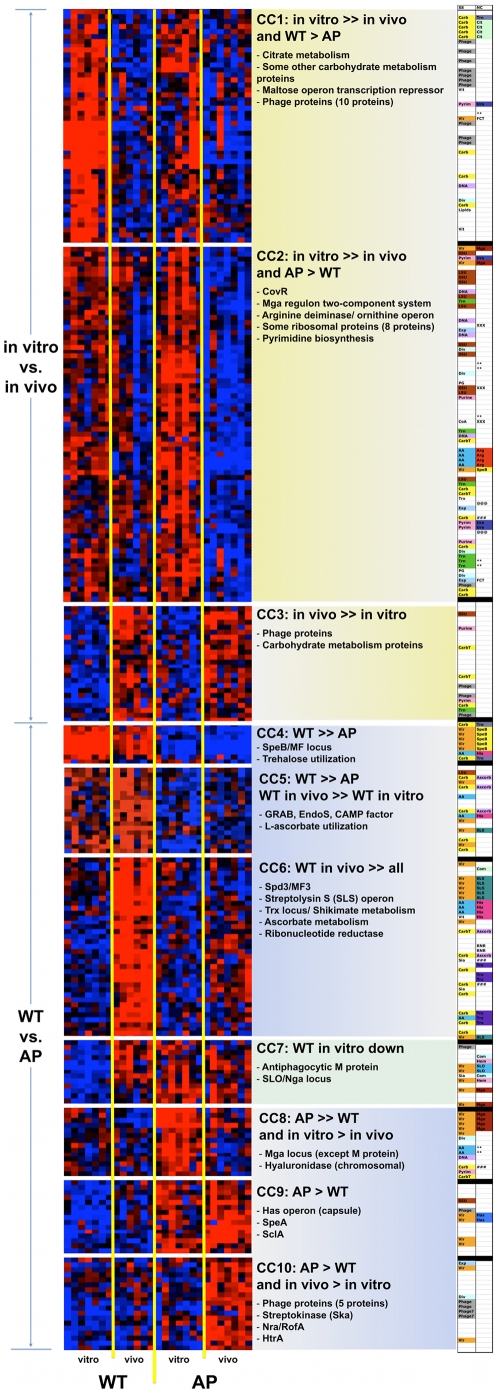
Figure 2. Pathovivogram of expression microarrays.
Heat maps of clustered normalized expression values from biological replicates showing ten major coexpression clusters (CCs). Shades of red: upregulation; shades of blue: downregulation; black: expression value below threshold. CC1-CC3 are clusters that differentiate bacteria grown in vitro from those grown in vivo (vivogram) and represent the adaptational transcriptional program. CC4-CC10 are clusters that differentiate WT from AP bacteria (pathogram), all of which but CC7 represent transcriptional differences driven largely by the AP mutation. CC7 represents transcriptional differences driven both by mutation and by in vivo adaptation. The right column displays the subsystems (SS) and neighbor clusters (NC) to which these genes belong. A higher resolution version of this figure is provided online as Figure S2. Detailed annotations are provided in Table S1.

