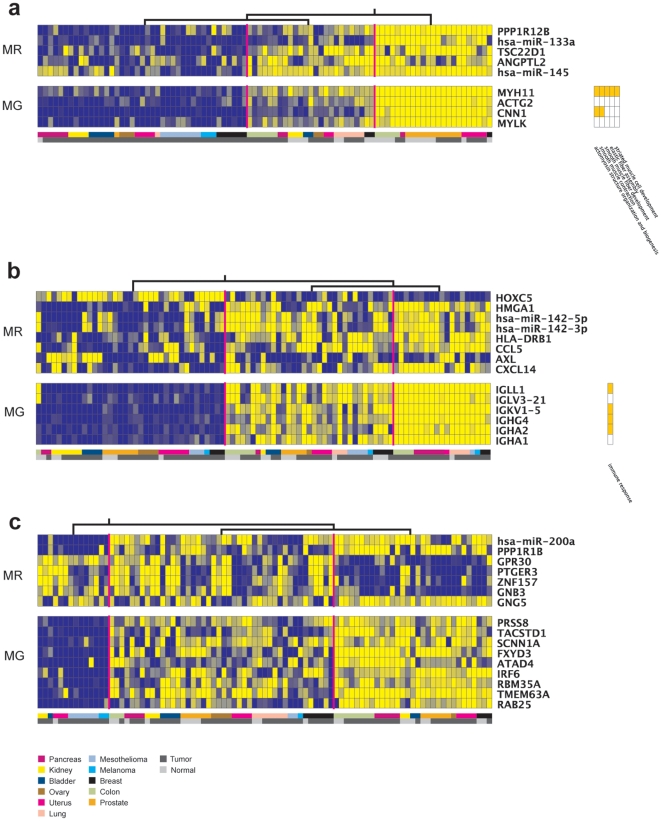
Figure 2. Modules 29 (a), 18 (b) and 25 (c) genes (MG) and assigned regulators (MR).
Gene expression values are color coded, ranging from dark blue (low expression levels) to bright yellow (high expression levels). In each figure, columns represent a different sample. The color-coded bar at the bottom of the graph represents the tissue origin (see the legend), while the gray squares just below indicate whether the sample tissue was normal (light gray) or tumor (dark gray). The candidate regulators are ordered by decreasing score value (from top to bottom). The samples are grouped in leaves of homogeneous expression values, according to the hierarchical trees indicated on top of each figure. The orange boxes at the right of the figure indicate overrepresented GO categories (p≤0.05).

