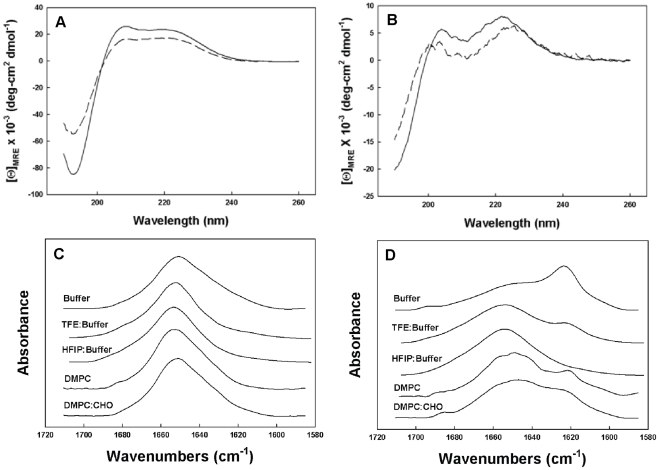
Figure 6. Circular dichroism (CD) and Fourier-Transform Infrared (FTIR) spectra.
Panel A shows CD spectra of D-4F and Panel B shows the spectra of OxP-11D. Spectra were obtained in two solvent systems: 10 mM phosphate buffer, pH 7.4 (dashed line ----), HFIP:Buffer, (10 mM, pH 7.4) 4∶6, v:v (solid line —). The peptide concentration was 100 µM, the cuvette light path was 0.01 cm, the temperature was 25°C, and the spectra are the average of 8 scans. Panel C shows FTIR spectra of D-4F and Panel D shows FTIR spectra of OxP-11D. The spectra were obtained in D2O Buffer, TFE: deuterium Buffer 4∶6, v:v, HFIP: deuterium Buffer, 4∶6, v:v, deuterium vapor hydrated DMPC multilayers (peptide:lipid, 1∶10, mole:mole), and deuterium vapor hydrated DMPC:CHO (DMPC:CHO,1.2∶1, mole:mole with a peptide to lipid ratio of 1∶10, mole:mole).

