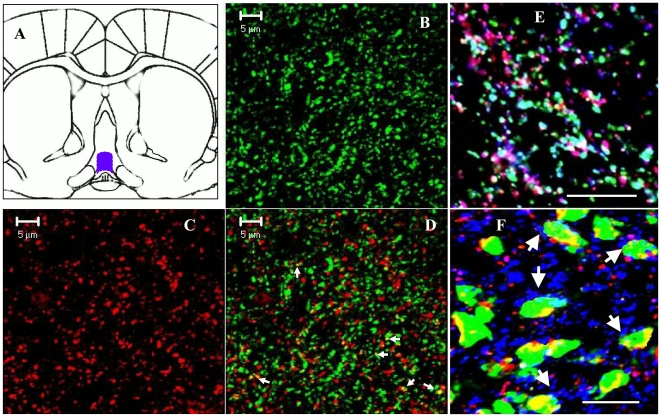
Figure 1. Expression of VGAT and VGLUT2 synaptic proteins in the rPOA of the proestrous female rat.
Figure 1A shows a schematic diagram of rat brain in coronal plane highlighting the POA region. Figures 1 B and C show 3D confocal images of VGLUT2 (green) and VGAT (red) obtained using 63X objective lens with additional 3X digital zoom. Both VGLUT2 and VGAT show punctate staining characteristics of presynaptic terminals. Figure 1D shows a merged (colocalized) image which indicates that while both VGLUT2 and VGAT proteins are highly expressed in the same region, only a small percentage (∼10%) of them show colocalization (white arrows) with each other. Figure 1E shows an enlarged view of VGAT (red) and VGLUT 2 (green) colocalization (>90%) with synaptophysin (blue) in the POA region. Figure 1F shows that almost all ERα positive (green) neurons show colocalization/co-expression (white arrows) of VGAT (red), VGLUT2 (blue) in the AVPV region. Scale bars represent 5 µm in Figure 1 B-D and 10 µm in Figure 1 E-F.

