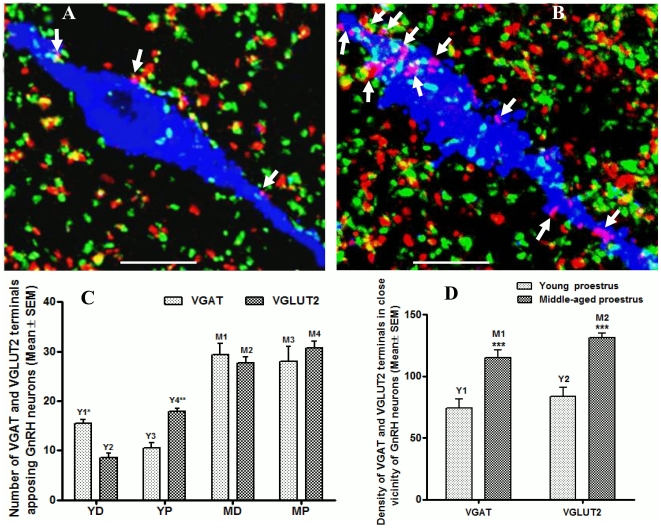
Figure 3. Cycle and age-dependent changes in VGAT and VGLUT2 terminals apposing GnRH neurons.
Figure 3A and B, confocal images showing expression of VGAT (red), VGLUT2 (green) and GnRH neuron (blue) from a young (Figure 3A) and middle-aged (Figure 3B) proestrus female rat, respectively. Figure 3C, shows statistical analysis of VGAT and VGLUT2 synaptic terminals apposing GnRH neurons. In young animals at diestrus, average VGAT terminals apposing GnRH neurons were significantly (P<0.001) higher (Figure 3C; bar Y1) than VGLUT2 terminals (Figure 3C; bar Y2). However, at proestrus afternoon, VGAT terminals apposing GnRH neurons were significantly (P<0.01) decreased (Figure 3C; bar Y3) whereas VGLUT2 terminals (Figure 3C; bar Y4) were significantly increased (P<0.001). In middle-aged animals at diestrus, average VGAT terminals (Figure 3C; bar M1) apposing GnRH neurons were not statistically different (P>0.05) from the number of VGLUT2 terminals (Figure 3C; bar M2). Similarly, at proestrus, the number of VGAT terminals (Figure 3C; bar M3) apposing GnRH neurons were also not statistically different (P>0.05) from the number of VGLUT2 terminals (Figure 3C; bar M4). Furthermore, in either diestrus or proestrus middle-aged animals, average VGAT (Figure3B, and Figure 3C; bars M1 and M3) and VGLUT2 (Figure3B, and Figure 3C; bars M2 and M4) terminals apposing GnRH neurons were significantly higher (P<0.0001) compared to young either diestrus or proestrus animals (Figure 3C; bars Y1 andY3 for VGAT and bars Y2 and Y4 for VGLUT2). A further analysis at proestrus showed that in middle-aged animal, density of both VGAT (Figure 3B, and Figure 3D; bar M1) and VGLUT2 (Figure 3B, and Figure 3D; bar M2) terminals in the area in close vicinity of GnRH neurons was significantly (P<0.0001) increased compared to young animals (Figure 3A, and Figure 3D; bar Y1 for VGAT and bar Y2 for VGLUT2). Scale in Figure 3 A and B represents 10 µm. Various abbreviations used in Figure 3C are: YD (young diestrus), YP (young proestrus), MD (middle-age diestrus) and MP (middle-age proestrus) animal groups.

