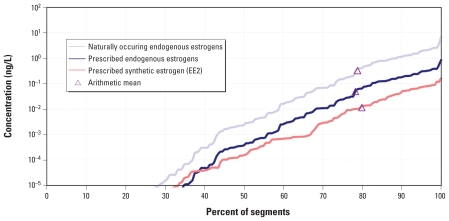
Figure 1.
Cumulative distribution (and arithmetic mean) of PECs generated by PhATE for three different categories of estrogens in U.S. drinking water assuming critical low-flow conditions (7Q10). For the endogenous estrogens, the combined concentrations of E1, E2, and E3 were not adjusted for differences in biological activity.

