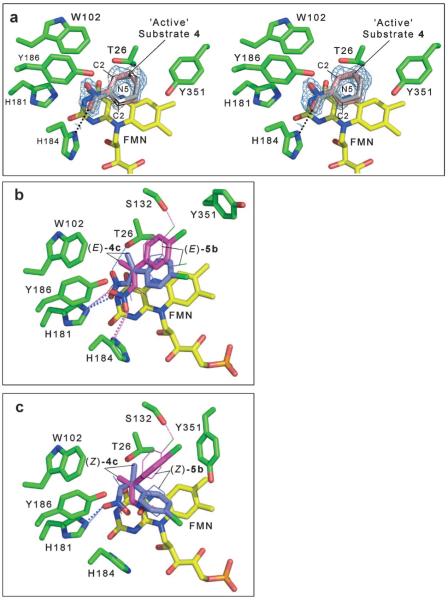
Figure 3.
Active site of PETN reductase containing bound substrate. The figures were generated in Pymol.[56] All residues are shown as atom-coloured sticks with green and yellow carbons for protein and FMN, respectively. Hydrogen bonds are indicated by dotted lines (grey lines indicate the bond is behind the side chain). (a) Stereo view of the 2 |Fo|–|Fc| electron density map contoured at 1 σ and final atomic model of the active site of 1-bound PETN reductase. The catalytic and non-productive positions for 1 are shown as atom-coloured sticks with pink carbons and grey lines, respectively. Dual models of the (b) (E)- and (c) (Z)-isomers of 4c and 5b bound in the active site of PETN reductase. The substrates (E)- and (Z)-4c are shown as atom-coloured sticks with magenta and blue carbons for models 1 and 2, respectively. The substrates (E)- and (Z)-5b are shown as atom-coloured lines with magenta and blue carbons for models 1 and 2, respectively. The hydrogen bonds are colour-coded to indicate the substrate and model, with large and small dots for (E/Z)-4c and (E/Z)-5b substrates, respectively.

