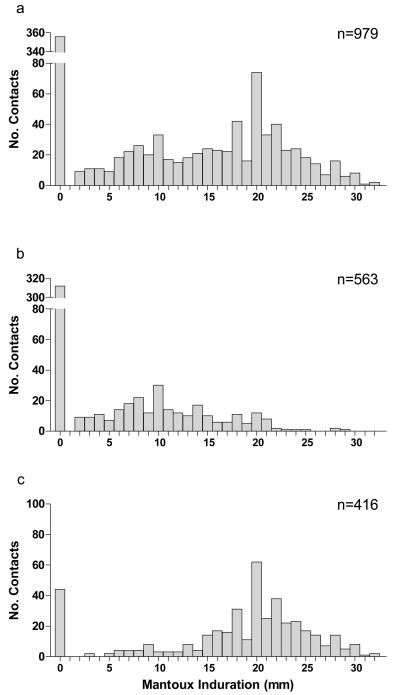
Figure 1. Distribution of TST indurations stratified by ELISpot responses.
a illustrates TST indurations for the whole group n=979, b shows TST indurations from ELISpot-negative contacts, and c illustrates TST indurations from ELISpot-positive contacts. Stratification by ELISpot results revealed that the bimodal nature of the overall distribution of TST measurements arises through combining two distinct distributions with different modal values, reflecting the infected and uninfected subgroups.

