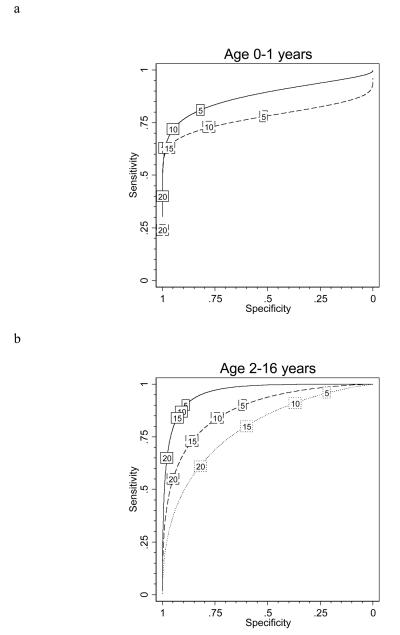
Figure 5. Fitted ROC curves of TST test performance compared with ELISpot results according to age and BCG scar status.
Fitted ROC curves of TST test performance compared with ELISpot results according to age and BCG scar status for a, under 2 year olds, and b 2-16 year olds. Solid lines indicate performance in those with no scar; dashed lines in those with 1 scar; dotted lines in those with 2 or more scars. Values in boxes indicate TST threshold in mm.

