
FIG. 1.
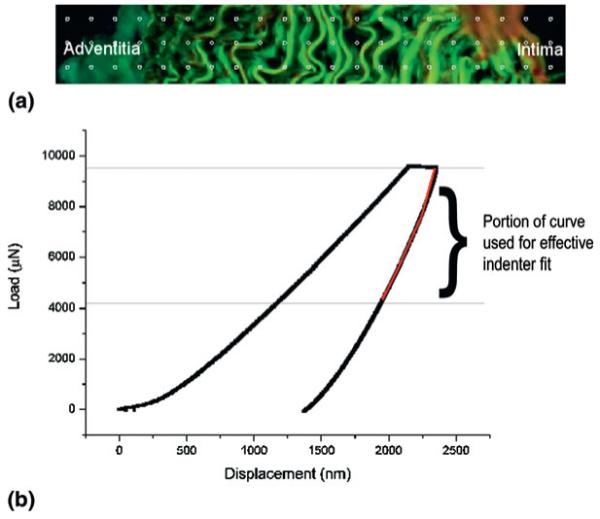
(a) Typical indent separations are represented by the grid. The distance between the points is 15 μm. (b) Typical load-displacement curve with the portion of the unloading curve used for the effective indenter fit indicated on the plot.
Official websites use .gov
A
.gov website belongs to an official
government organization in the United States.
Secure .gov websites use HTTPS
A lock (
) or https:// means you've safely
connected to the .gov website. Share sensitive
information only on official, secure websites.
(a) Typical indent separations are represented by the grid. The distance between the points is 15 μm. (b) Typical load-displacement curve with the portion of the unloading curve used for the effective indenter fit indicated on the plot.