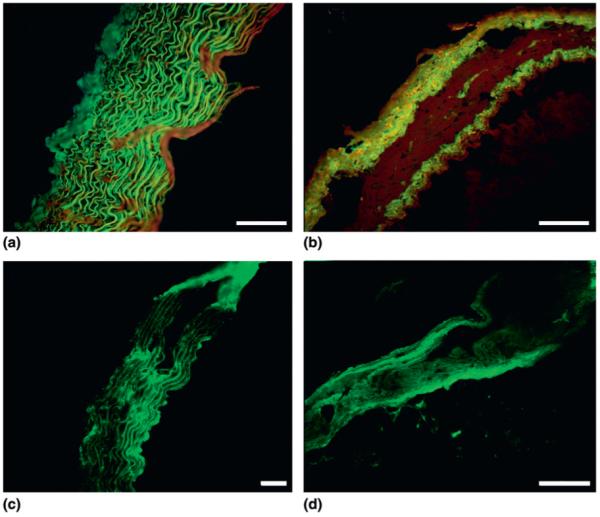
FIG. 3.

Fluorescent images showing (a) H&E stained ferret aorta section. (b) H&E stained ferret vena cava section. (c) Unstained ferret aorta section showing elastic fiber distribution due to elastin autofluorescence. (d) Unstained ferret vena cava section showing elastic fiber distribution due to elastin autofluorescence. Note the darker region in the central portion of the vena cava images, which indicates the presence of little elastin. Scale marker represents 100 μm in each image. The adventitial layer is leftmost in each image with the intimal layer rightmost.
