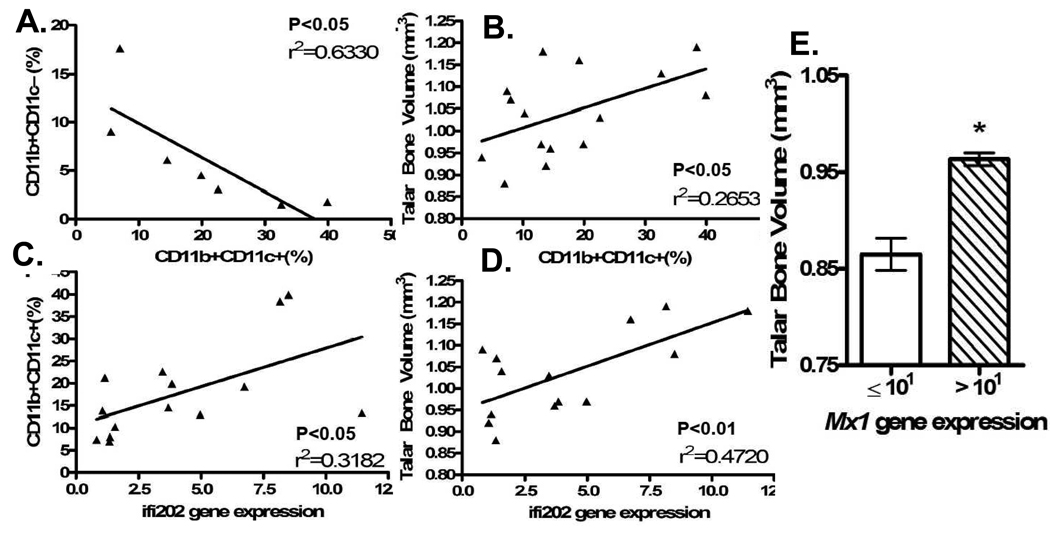
Figure 5. There is an inverse relationship between OCP and DCP frequency, and a direct correlation between the IFN-α transcriptome in PBMC and bone volume.
To demonstrate that the non-erosive phenotype of inflammatory arthritis during concomitant lupus is mediated by IFN-α stimulated monocyte differentiation that is non-permissive of osteoclastogenesis, we performed linear regression analyses using the flow cytometry, real time RT-PCR, and micro-CT data described in this study. (A) Linear regression analysis of the percentage of CD11b+CD11c− versus CD11b+CD11c+ PBMCs for NZW mice with arthritis and mice with an elevated IFN-α transcriptome. (B) Linear regression analysis of percentage of CD11b+CD11c+ PBMCs and talar bone volume. (C) Linear regression analysis of percentage of CD11b+CD11c+ PBMCs and Ifi202 gene expression data. (D) Linear regression analysis of talar bone volume and Ifi202 gene expression data. (E) Mx1 mRNA levels in PBMC were determined by real time RT-PCR and the samples were divided based on a threshold expression level of 101 and compared to the average talar bone volume of the mice in that group. Individual points and bars represent mean value for 3–5 mice. * p<0.05 versus Mx1 gene expression <101.

