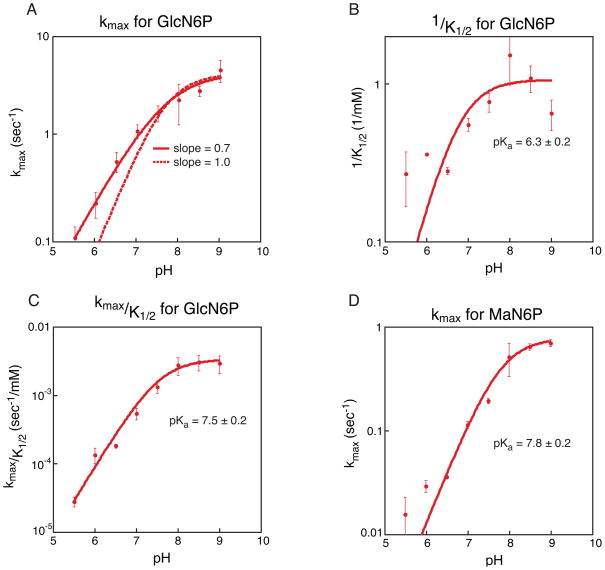
Figure 6.
Kinetic analysis of GlcN6P and MaN6P activation of the glmS ribozyme. A. Plot of pH versus average kmax for GlcN6P activation of the glmS ribozyme. Three independent kinetic trials were run for each concentration at each pH and three independent values of kmax were determined; the average of the three values is depicted. Error bars represent the standard error on the average. In solid red is the best fit to the data, producing a slope of 0.7. The dotted line is the fit to the same data but forcing the slope of the line to be 1. B. Plot of pH versus 1/K1/2 for GlcN6P activation of the glmS ribozyme. Three independent kinetic trials were run for each concentration at each pH and three independent values of 1/K1/2 were determined; the average of the three values is depicted. Error bars represent the standard error on the average. Three independent pKa’s were calculated and the average value is given; reported error is the standard error on the average. C. Plot of pH versus kmax/K1/2 for GlcN6P activation of the glmS ribozyme. As in plot B the values given are averages and errors and error bars represent the standard error of three trials. D. Plot of pH versus kmax for MaN6P activation of the glmS ribozyme. As in plot B the values given are averages and errors and error bars represent the standard error of three trials.

