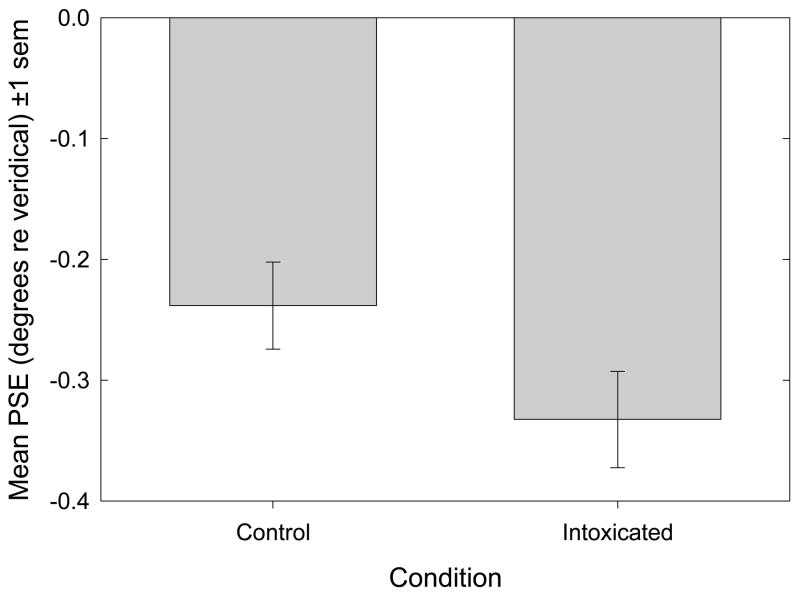
Figure 2.
Bisection Accuracy (Bias). Mean p.s.e (±1 s.e.m.) is plotted as a function of experimental condition. Mean leftward bisection errors in both control and intoxicated conditions were significantly leftward of zero: t17 =−4.14, p<.001, d =−2.01 and t17 = −5.77, p<.001, d =−2.80, respectively. A paired-samples t-test discloses that ethanol causes a significant increase in bisection error: t17 = −3.88, p=.001, d = −1.88.

