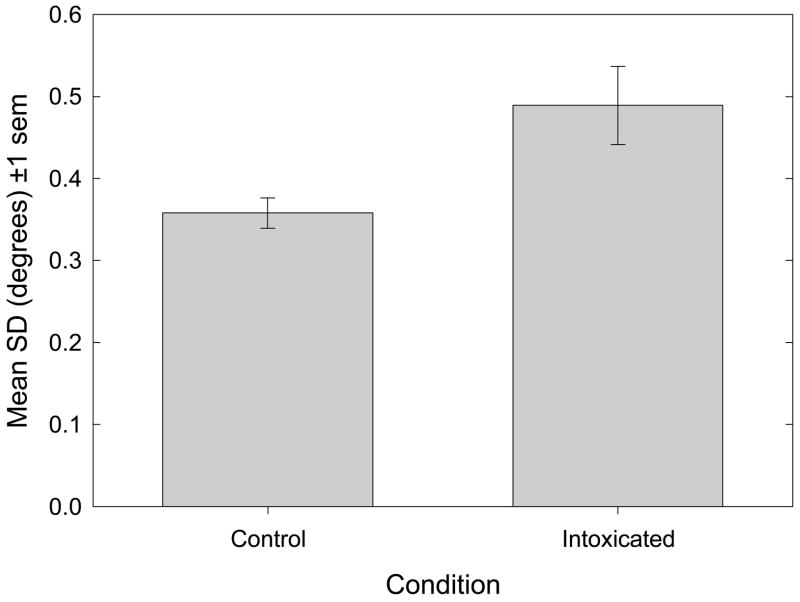
Figure 3.
Bisection Precision. The mean standard deviation parameter (+/− 1 s.e.m.) is plotted as a function of experimental condition. A paired-samples t-test discloses that ethanol causes a significant increase in the standard deviation of the cumulative normal function used to fit the psychometrics, indicating decreased bisection precision: t17 = 3.03, p=.008, d = 1.47.

