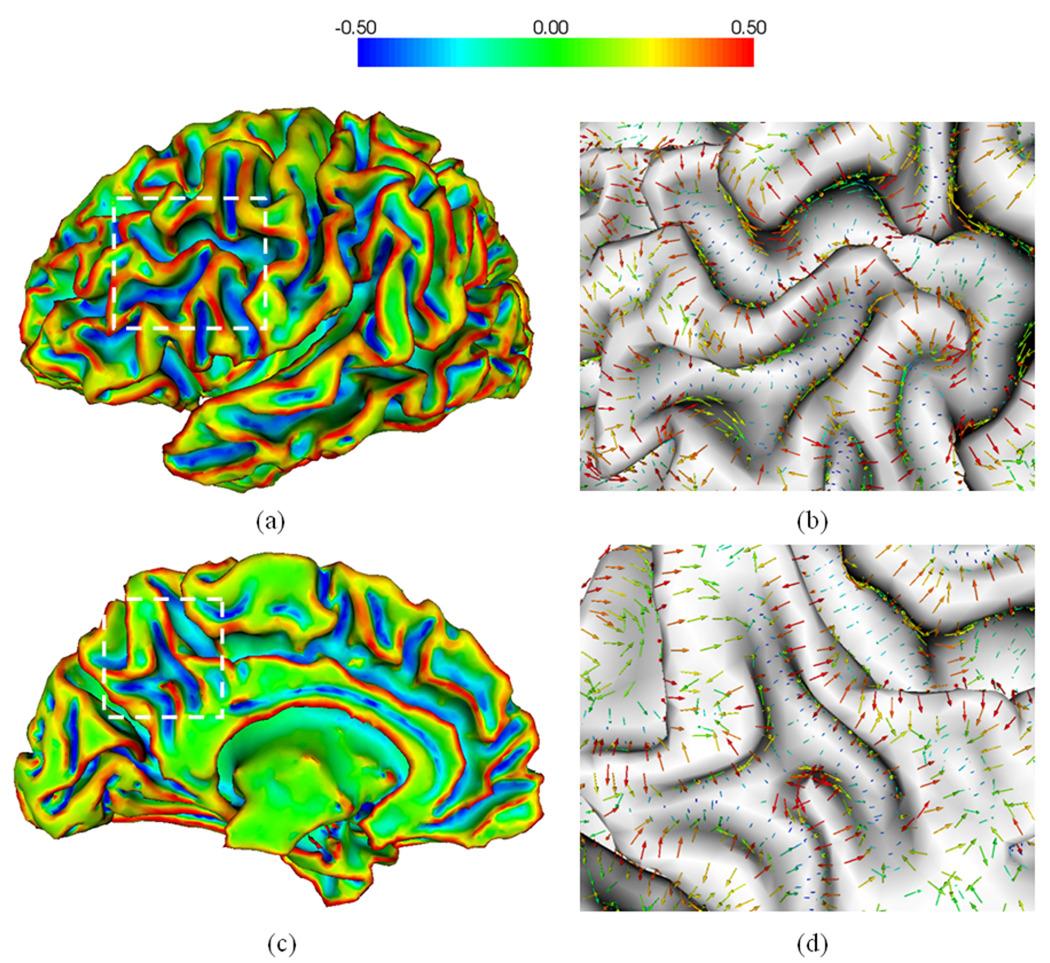
Fig. 3.
An example of the estimated maximum principal curvatures and their corresponding principal directions on a cortical inner surface. (a) is the lateral view of the surface; (c) is the medial view of the surface. (a) and (c) are maximum principal curvature maps; (b) and (d) are zoomed views of principal directions overlaid on the surface in the rectangular regions in (a) and (c) respectively. The color bar is shown on the top.

