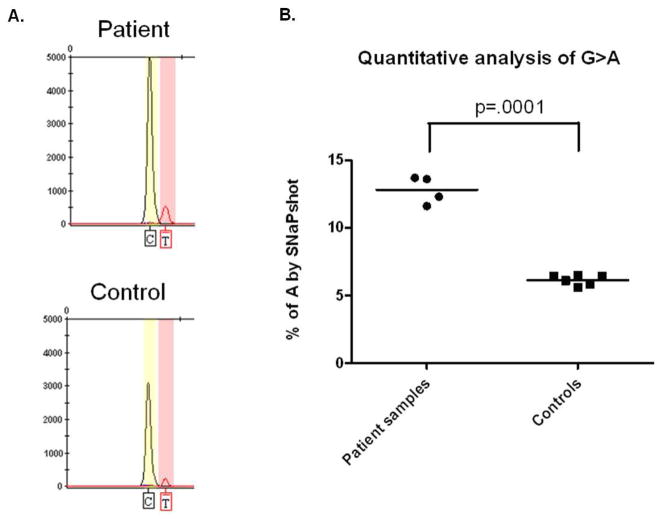
Figure 2.
Quantitative analysis of TSC2 1444-1G>A mutation using SNaPshot. A. Genemapper image shows that extension products corresponding to the mutant A allele are detected in both patient and control blood DNA (reverse primers being used here). B. The frequency of the mutant allele in the patient was significantly higher than in controls in replicate analyses (unpaired Mann Whitney test).

