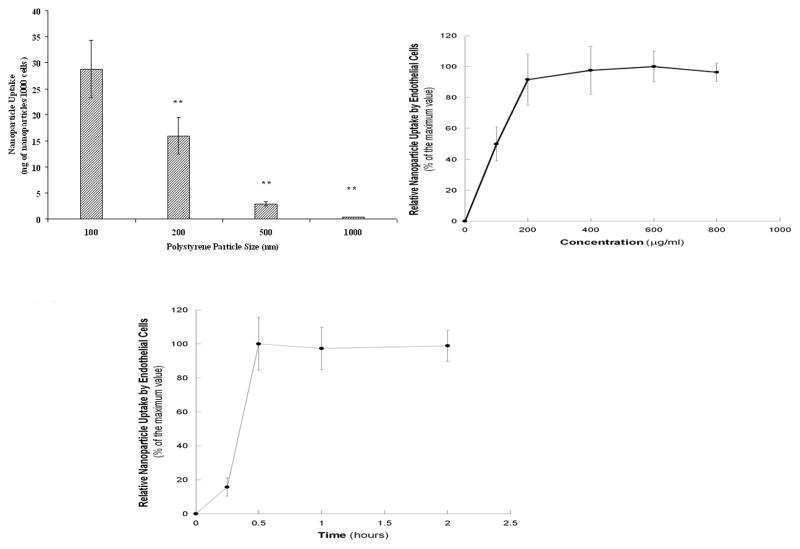
Figure 2.
Figure 2A. Effects of the particle size on the cellular uptake of polystyrene nanoparticles in ECs. Values were obtained after one hour of incubation with nanoparticle solutions and represent mean ± SD (n=6). ** indicates significant differences compared to the 100-nm nanoparticle samples (p<0.001).
Figure 2B. Effect of concentration on the cellular uptake of 100-nm polystyrene nanoparticles in ECs. Values were obtained after one hour of incubation with nanoparticle solutions and represent mean ± SD (n=6).
Figure 2C. Effect of the incubation time on the cellular uptake of 100-nm polystyrene nanoparticles in ECs. Samples were incubated with 100 μ/ml of nanoparticle solution. Values represent mean ± SD (n=6).

