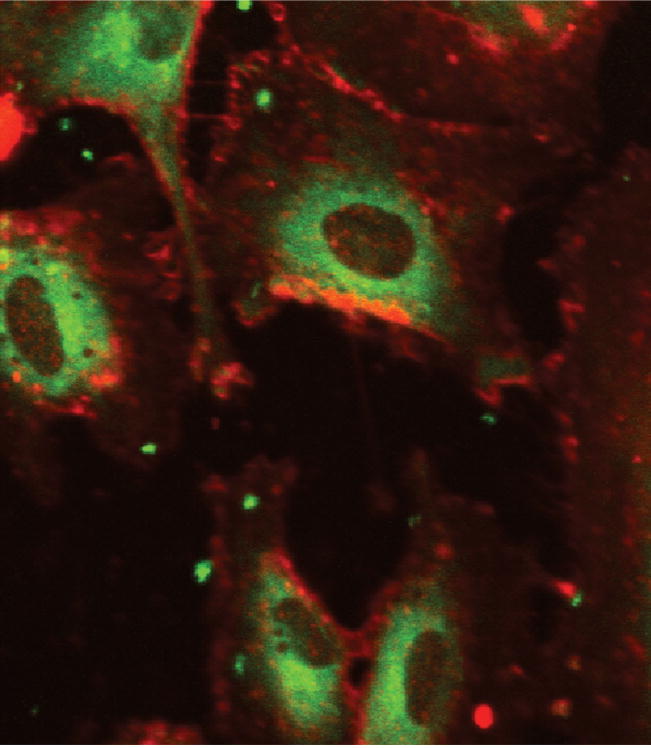
Figure 3.
Confocal Images of Nanoparticle Uptake in ECs. Represents cells incubated with polystyrene nanoparticles. Plasma members were dyed using Texas Red® and imaged using a RITC filter. Fluorescent nanoparticles were imaged using a FITC filter. Images represent an overlay of RITC and FITC filters and were taken at Ex(λ) 488 nm, Em(λ) 543 nm.

