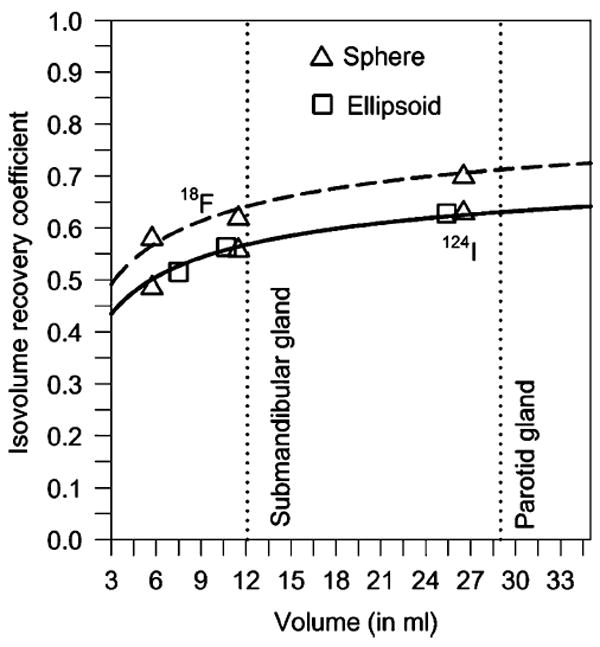
Fig. 2.

Isovolume recovery curves of 124I (solid line) and of 18F (dashed line) for EXACT HR+ PET scanners measured with a cylindrical phantom containing radionuclide-filled spheres and rotational ellipsoids. The ratio of the prepared objects’ to the background activity concentration was 12. The data points were fitted using a three-parameter sigmoid function (solid line). The dashed line was obtained by multiplying the 124I fitting curve with a scaling factor of 1.13. The dotted lines represent the mean submandibular and parotid gland volumes observed in this study
