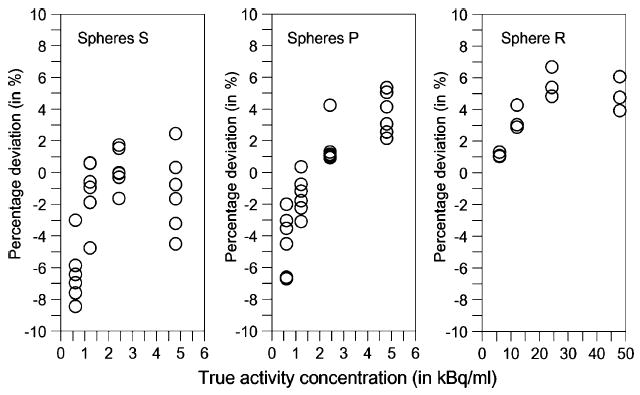
Fig. 3.

Deviation between RC-corrected and true activity concentration in percentage of the true activity concentration for the spheres S1 and S2 (left), spheres P1 and P2 (middle), and sphere R (right) at different activity concentration regimes. The individual deviations of the three scans acquired with the clinical acquisition protocol are shown
