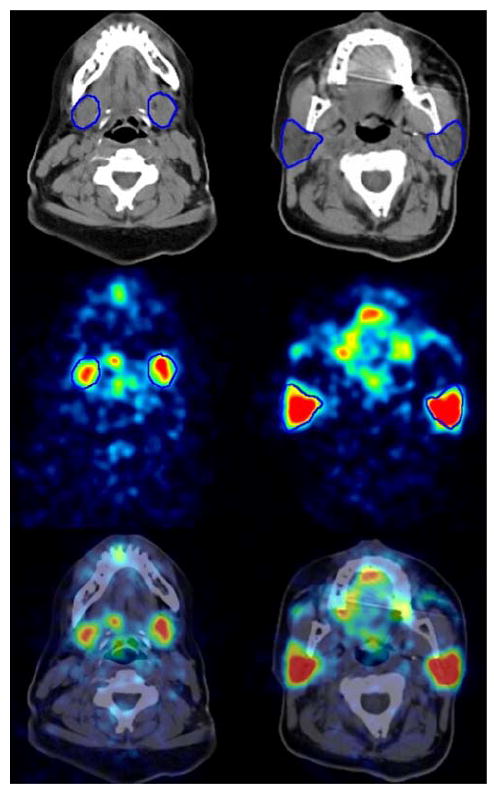
Fig. 4.

CT image (top), PET emission image (middle) 4 h after 124I administration, and fused image (bottom) of the submandibular (left) and parotid gland (right) with ROIs (in blue) delineating the boundaries of the salivary glands. The gray (CT) and color scale range (PET) were −125 to 225 HU and 0 to 2 kBq/ml, respectively
